Microsatellite analyzer (MSA)
4.05
Description
of genetic distances
![]()
-
MSA is
a universal, platform independent, data analysis tool.
- The MSA software
tool was designed to handle large microsatellite data
sets. To avoid error prone reformatting, MSA uses a simple input
format, very
close to a simple spreadsheet.
- Microsatellite analyzer
calculates the standard suit of descriptive
statistics and provides input files for other software packages.
Background:
Input
files can be generated using spreadsheet software, such as Excel,
in which the data are arranged either in one column per locus or two
columns
per locus (sample input file). As MSA was mainly designed for
microsatellites,
data should be entered as the PCR product size. Missing data can be
indicated
by either an empty cell or a negative value, but do not enter
Ô0Õ as this would
be treated as a PCR product of zero bases. Note that the two-column
format
provides some additional input options (see below).
Please note if Excel is used to generate a MSA inputfile
it has to be saved as "TAB
DELIMITED" file.
Size constraints:
The
number of individuals, populations and loci are only constrained by
the available memory.
Generation of a MSA input
file:
- To modify the spread sheet
insert 3 rows above and 3 columns to the
right of your data.
- Enter in the cell A1 whether
your data are arranged in the one column
(1) or two column (2) format
- Enter the name of the
population in the first column. Take care that no
cell remains empty, as MSA stops reading the data after the first empty
cell.
- The second column specifies
whether your data are inbred (h) or outbred
(d). Note that the same allele needs to be entered twice when only a
single
allele was detected (empty cells are thought to be missing data).
Please note
that this column must not remain empty.
á
The third column allows to
group populations and some analyses will be
also performed for the specified groups. Please note that this column
must not
remain empty. In the absence of grouping give the same number to all
populations. Furthermore, only consecutive group numbers are allowed,
but
groups assigned without any constraints in order.
á
The first two rows provide
information about each locus. The first row
specifies the repeat type (1, 2, 3, etc). The second row indicates the
length
of the sequence flanking the microsatellite (in bp). In the case no
information
is provided in the second row (empty cell), MSA does not calculate the
variance
in repeat number, but the inferred repeat type is specified in the
output file.
This option allows MSA to calculate the number of repeats from your PCR
product
size.
á
The third row contains the
name of the microsatellite locus. In the
two-column format, MSA allows two different names for the same locus
(each
entered in one cell).
Remarks:
For
compatibility with PHYLIP the population labels are limited to 8
characters. For individual based distances, only the first 4 characters
of the
population label are used to label individuals. Therefore, it is highly
advised
that the first 4 characters differ among population labels.
If
you are formatting your data with Excel (or other spreadsheet
software), please make sure that you saved it in the format "TAB
DELIMITED". Other formats will not be accepted by MSA.
Generation of a MSA IM input file (for IM-input file
conversion only):
á
Create the normal MSA input
file
á
Make a copy with a different
name
á
Open the copy and remove all
data (population names and alleles) so that
only the locus information is left
á
Write 'inheritance' as one
"individual" name and then below
the (first) locus names the value of the wanted inheritance scalar
(e.g. 1 for
autosomes, 0.75 for X-chromosomes, 0.25 for Y-chromosomes or mtDNA, ...)
á
Write 'mutation' as another
"individual" name and do the same
with the mutation rates (As mutation rate per year).
á
Save the file AGAIN AS
"TAB-DELIMITED"
á
In MSA menu you
need to go to the submenu '(c)...Data conversion settings', chose the
option
'(f) ... Locus information
for IM : No'
and enter the name for the file containing the inheritance information.
á
For an
example file with the inheritance information see
ãtestdata.imÒ
Starting the
program:
Option
1: double clicking:
Windows:
double click to start the program and follow the instructions on the
screen
OsX:
double click to start the program
Load
data by selecting option i) in the start menu of MSA. Rather than
typing the name of the input file, drag and drop the input file to MSA
window.
By doing so you automatically specify the path (location of your input
file).
Option
2: command line (OsX, works similar for Linux)
open the 'Terminal'
software (located in: Applications->Utilities)
type: cd note that 'cd'
is followed by a blank
drag the folder
containing the MSA executable and input file onto the Terminal window
hit the 'return' key
type: ./msa
hit the 'return' keyagain
the normal MSA menu will
appear and the input file could be specified by
typing its name. Note: the path does not need to be specified, as the
file is
located in the same folder as the executable.
Available
Functions:
Starting
with MSA version 4.0 it is also possible to use command line arguments,
instead of using the MSA menu.
Starting
MSA without any argument will open the MSA menu. Starting MSA with
arguments use
MSA without
open the MSA menu. So please if you
are not sure how to use this, start MSA without any argument and MSA
will behave
as normal.
Explanation
of the following notation:
Statements in
"[]" are optional and has not to be given, MSA will use standard
settings instead of. If Statements are written like [g[lobal]] then you
can use
'global' OR only 'g' to activate the function.
YES/NO means you have to choose between the two possibilities YES OR NO. Same is true for all other statements ON/OFF, 1/LN
XXXX means
that you have
to enter a number.
Please write
command as
they are given below (small/capital letter) otherwise the result can
not
predicted.
For more
information
about functions itself and the output files please read the chapters
below!
MSA
Command Line Options:
► -i:
"FILENAME"
Specifies the
input file for MSA
(essential)
► -fim:
"FILENAME"
In this file
is the additional
information required for conversion into the IM-Format. This has nearly
the
same format as MSA-Input. Please look at the sample file and below.
► -fst: [g[lobal]]
[p[airwise]] [beta] [n=XXXX] [HW[=YES/NO]] [RD[=ON/OFF]] [locus]
This
option starts FST
analysis: essential is to give either
[global] and/or [pairwise] for global FST
or FST
pairwise between populations.
[beta]
calculates the moment
estimator ![]() Ð
values
of the data
Ð
values
of the data
[n=XXXX]
sets the number of permutations standard is 10000 (n=1 means no
permutation)
[HW[=YES/NO]]:
Hardy-Weinberg-Equilibrium is by default NO (HW=NO) so use HW or HW=YES
when
you assume your data to be in HW-equilibrium.
[RD[=ON/OFF]]
Random discard inbreed lines before calculating FST
is by default OFF (RD=OFF) so use RD or RD=ON to activate this.
[locus] For
pairwise FST
this option gives the FST
values for each
population pair and locus.
► "-dist:"/"-dist " [p[opulation]]
[i[ndividual]] [...] [n=XXXX] [calc=1/ln] [NEXUS] [locus]
Calculates
standard genetic distances. It is essential to activate at least
[population]
or/and [individual].
[...]
You have to specify at least one distance method to get results, use
one of the
following codes:
POSA ...
Dps
proportion
of shared alleles
FSS ...
Dfs
fuzzy
set similarity
ADA ...
Dad
absolute
difference algorithm
KSC ...
Dkf
kinship
coefficient
DMS ...
Ddm
(dµ)2
ASD ...
D1 average
square
CAS ...
Dc
Cavalli-Sforza
and Edwards chord distance (1967)
DAN ...
Da
Nei's
chord distance (1983)
DSG ...
D
Nei's
standard genetic distance (corrected for sample size)
[n=XXXX] Number of bootstraps.
Standard is no bootstrapping (n=1).
[bl=XXXX] Specifies the number
of loci for bootstrapping DS. Standard is the same number as original
dataset
(bl=-1)
[calc=1/ln]
Some distances (see below) can be calculated by two ways: 1-factor
(standard
calc=1) or Ðln(factor) calc=ln. (Please don't use calc only!)
[NEXUS]
Nexus outputfiles can be generated for individual based distances
without
bootstrapping
[locus] For
pairwise distances this
option gives the distance values for each population pair and locus.
► -format: [msvar] [arlequin] [migrate] [im]
To
convert your data into additional formats, use this options:
[msvar]
MSVAR (Beaumont) input format for each population separately
[arlequin]
Calculates ARLEQUIN input files.
[migrate]
Gives input files for MIGRATE.
[im] Creates
for all population
pairs the IM input files.
► -hetrange: [n=XXXX] [RD[=ON/OFF]]
[zero[=ON/OFF]]
[l[inked]] [ind[ividual]]
Estimate
the sampling variance of gene diversity (using bootstrapping)
[n=XXXX]
Number of replications (Standard is 1000)
[RD[=ON/OFF]]
Activates random discarding for inbreed data. (Please use this only
together
with [individual])
[zero[=ON/OFF]] Correction for
gene diversity 0 and 1 is by default ON (zero=ON) to deactivate this,
use zero
or zero=OFF.
[l[inked]] By default all loci
are assumed to be unlinked and therefore resampled separately. Use
linked to
change this (all loci are then completely linked). Activate also
[individuum]
or you would resample chromosomes (ever the first/second chromosome
together)!
[ind[ividual]] Sample
individuals instead of chromosomes (loci can
also be unlinked!).
► -rare: [number]
Sets
the reference population size to calculate the allelic
richness/rarefraction.
(-1:
minimal sample size =STANDARD)
All
descriptive statistics are given per population and locus.
á
Allele counts and frequencies
á
Number of chromosomes per
population and locus
á
expected number of alleles for
each locus (IAM [Ewens W.J., 1997] and SMM [Kimura
and Ohta,
1975])
á
Allelic richness [El Mousadik A. and Petit R.J.,
1996; Hurlbert
S.H., 1971; Krebs
C.J., 1989]
and the variance of this value.
á
observed heterozygosity
á
expected heterozygosity (=gene
diversity), corrected for sample size
á
estimate of theta based on
gene diversity and the SMM mutation model
á
constrained
gene
diversity
(0<H<1)
á
variance in PCR product size
and in repeat number, corrected for sample
size
á
Shannon index of diversity [Shannon and
Weaver]
Shannon entropy
á
minimum, maximum, and mean
allele length
á
minimum, maximum, and mean
repeat number.
á
hs Nei's unbiased
estimator for gene diversity [Nei M,1987 p.164]
(this option is available only for
"outbred" populations)
á
FIS (only for "
outbred" populations) for each
population
á
estimate for the sampling
variance of gene diversity (using
bootstrapping)
á
Calculation of GST with the methods
from Nei as well as
Hamrik & Godt (for comparison of this methods see [Culley
et al. 2002]).
á
Calculation of GST' for both
methods (see above) [Hedrick
P.W., 2005]
Remarks:
á
For inbred lines, expected
heterozygosity, variance and number of
alleles are determined for 200 randomly discarded data sets and the
mean will
be reported. Note that this procedure could result in non-integer
allele
counts.
á
MSA also provides most
descriptive statistics for the specified groups
by reporting the unweighted mean of all populations in a given group.
á
Standard allelic richness is
calculated based on the minimum number of
sampled individuals (total individuals Ð missing data) for each
locus. The
drawback is, that only populations within the same data set can be
compared. To
avoid this, it is possible to specify the number of individuals used
for all
loci. If this number is provided in a publication, the result could be
compared
across publications. Note, however, that for populations with a smaller
sample
size than specified the allelic richness is not calculated ('n.d.').
á
proportion of shared alleles Dps
á
fuzzy set similarity Dfs
á
kinship coefficient Dkf
á
absolute difference algorithm Dad
á
(dµ)2
Ddm
á
average square D1
(ASD)
note
that this distance is not available for tree of individuals
á
Da Nei's chord
distance (1983)
á
D Nei's standard
genetic distance (corrected for sample size)
á
Dc
Cavalli-Sforza and Edwards chord distance
(1967)
Statistical
support: A bootstrap option is available for all distances (select this
option
in the distance menu [n]).
When using bootstrapping, (and only then) there is the additional
option of
bootstrapping a user specified number of loci. Hence, MSA will only
resample N
loci from the total data set.
Dps,
Dfs, Dkf and D can be calculated
in two alternative ways:
Ðln(similarity factor) or 1-(similarity factor).
Remarks:
á
All distances can be
calculated between populations or between
individuals. Make sure, that the usage of an individual-based distance
makes
sense.
á
Genetic distances are
calculated WITHOUT randomly discarding alleles for
inbred data sets. In the case distances should be calculated from a
randomly
discarded data set, use the file "FILENAME_2C_RD" and run MSA again.
á
Genetic distances which
consider size differences between alleles [(dµ)2,
D1, Dad] require that the repeat size is specified in the
input
file. The errorreport.txt file provides information on the minimum size
difference among alleles. For loci evolving in a stepwise manner, this
corresponds to the repeat size.
á
Distance matrices between individuals
without
bootstrapping can be saved in NEXUS format instead of PHYLIP format.
NOTE: The menu option to activate
this function is invisible until distances
between individuals are NOT activated, therefore activate FIRST
distances
between individuals and then you get this menu point visible!
á
Global FST,
FIS, FIT estimators [Weir,
B.S. and Cockerham, C.C., 1984] across all
loci
á
Global FST,
FIS, FIT estimators per
locus
á
FST, FIS, FIT estimators [Weir, B.S. and Cockerham, C.C.,
1984] across
loci and between population
pairs
á
FST-values per locus
and population pair
á
P-values for FST (global and
pairwise) and with and
without bonferoni correction for P-values of pairwise FST's.
á
Estimation of the
heterogeneity in F-statistics among loci (based on
bootstrapping)
á
Calculation of the moment estimator
![]() for
populations and between
population pairs
for
populations and between
population pairs
[Weir, B.S. and Hill, W.G.,
2002]
á
GST and GST' calculation is
included in the
calculation of global FST. Similar to FST,
p-values are as the proportion of
permutations that result in a GST or GST'
larger than or equal to the observed GST (GST')
value.
Statistical support:
When loci are unlinked and in
Hardy-Weinberg equilibrium, permutation of
alleles should be selected. Otherwise, genotypes should be permuted,
which is a
conservative but not entirely satisfactory procedure. [Michalakis
and Excoffier (1996)].
For
inbred lines a special option exists, which provides an estimate for
the variance introduced by the random discarding of alleles. For each
population consisting of inbred individuals a user specified number of
discarded
data sets will be produced and the FST values will be
calculated for each data set. The statistical significance of the FST
value for each data set will be determined by permutation. MSA reports
mean FST
and
P values.
P-values
are given without bonferoni correction (right above diagonal)
and with bonferoni correction (left below diagonal). Values after
bonferoni
correction above 10% (0.1) are reported as 'n.s.' in general.
P-values
for global FST
estimates are calculated across all loci
as well as for each locus separately. Note that random discarding of
alleles
(optional for inbred lines) is not possible for global FST
estimates.
There
is no possibility for a statistical test for the moment estimator ![]() .
.
The
calculation of lnRH (see Kauer, Dieringer & Schlštterer,
Genetics (2003)) and theta require gene diversities larger than 0 and
smaller
than 1. In the case of an invariant population MSA adds one different
allele to
the data set before calculating the gene diversity. For populations
with gene
diversity =1 MSA duplicates one allele before calculating gene
diversity.
Data bootstrapping (also called Hetrange)
MSA has the
function to bootstrap over individuals or chromosomes within
populations to get
the range within the gene diversity, the variance and the number of
alleles can
vary just by sampling.
The
program reports:
á
Large gaps in allele sizes at
a given locus
á
Outlier alleles
á
Discrepancies between the
assumed and observed step size
á
Inferred step size if no
repeat type was specified in the input file
![]()
This
file provides all settings used for the analysis of the data and
could be used for documentation purposes.
The
program converts your data into following formats:
á
GENEPOP two digit format
á
MSVAR (Beaumont) input format
for each population separately
á
STRUCTURE
á
ARLEQUIN
á
MIGRATE-format
á
Randomly discarded datasheets
(1 column and 2 column format), in which
all populations are marked, as inbred (h) will be randomly discarded
for one
allele.
Also the corresponding GENEPOP
files will be written.
All files, which contain randomly discarded alleles, are marked with
the
RD-label. Non-inbred populations will not be changed. RD input files
are
generated automatically for GENEPOP and STRUCTURE.
á
IM-format
Creates for all possible population pairs the input files (IM =
isolation and
migration by Jody Hey and Rasmus Nielsen).
NOTE: You
need an additional file for IM to set the inheritance scalar
(standard = 1) and the migration rate per year (see IM documentation
for this).
See input file
for this.
LAMARC's XML-format can be
easily obtained by
converting the MIGRATE-format into LAMARC-format (see LAMARC
documentation).
ARLEQUIN has optional setting
for genetic structuring
(only for AMOVA important). MSA will use for this setting the given
grouping in
MSA data sheet.
Remarks:
á
MIGRATE, ARLEQUIN, MSVAR and
IM input formats require that the alleles
correspond to the number of repeats (not to the allele length),
therefore make
sure, that your microsatellites behave AS EXPECTED (observed mutational
step =
size of repeat unit). This can be easily checked in the error
report-file. MSA
will assume that the observed mutational step size is the correct one.
Alternatively,
select option: "reduce to stepsize", which bins the observed alleles
into size classes specified in the input file. Allele bins are
constructed by
reducing the observed size to the next size class compatible with the
specified
repeat number. As indels of unknown size contribute to these size
shifts, the
preferred strategy is to remove all loci with incorrect mutation step
sizes
from your data set, before converting it.
á
For data sets containing
inbred individuals, randomly discarded
datasheets must be used to generate the MSVAR, ARLEQUIN, MIGRATE or IM
formats:
simply re-run MSA and use the randomly discarded data set as input
file.
á
The results of each run of MSA
are stored in a directory labeled
FILENAME_resultXX. FILENAME is name of you data sheet and XX is a
number
between 0 and 99. In the case of multiple runs using of the same data
set, the
result directories are consecutively numbered.
á
In each directory various
files and subdirectories can be found. The
table below provides information about the content of the files
generated by
MSA.
|
Subdirectory |
Name of
file |
Description |
|
|
Errorreport.txt |
The error
report of the data set. Possible errors (wrong mutation step, large
gaps, ...) detected from MSA. |
|
|
Summary.xls |
All
summary statistics split by locus and populations |
|
|
MSA.log |
The
protocol of the analysis |
|
|
|
|
|
Allelecount |
|
|
|
|
Allelecount.xls |
Allele
counts |
|
|
Allelefrequency.xls |
Allele
frequencies |
|
Distance_data |
|
Distances
between populations are marked with _POP, between Individuals with IND |
|
|
ADA_XXX.txt |
Dad,
Absolute differences |
|
|
ASD_XXX.txt |
D1,
Average square |
|
|
CAS_XXX.txt |
Dc, Chord
distance |
|
|
DAN_XXX.txt |
Da,
NeiÕs distance |
|
|
DMS_XXX.txt |
Ddm, Delta
mu square |
|
|
FSS_XXX.txt |
Dfs, Fuzzy
set similarity |
|
|
DSG_XXX.txt |
NeiÕs
standard genetic Distance (1978) corrected for small samplesize |
|
|
KSC_XXX.txt |
Dkf,
kinship coefficient |
|
|
POSA_XXX.txt |
Dps,
proportion of shared alleles |
|
F-Statistic |
|
|
|
|
FIS_WC84.xls |
Fis |
|
|
FIS_WC84_MULTI.xls |
Mean Fis from repeated randomly discarding (for inbred
lines only) |
|
|
FIT_WC84.xls |
Fit |
|
|
FIT_WC84_MULTI.xls |
Mean Fit from repeated randomly discarding (for inbred
lines only) |
|
|
FST_WC84.xls |
Fst |
|
|
FST_WC84_MULTI.xls |
Mean Fst from repeated randomly discarding (for inbred
lines only) |
|
|
FST_WC84_OG.xls |
Upper
value of the 95%CI for Fst from repeated randomly discarding (for inbred
lines only) |
|
|
FST_WC84_UG.xls |
Lower
value of the 95%CI for Fst from repeated randomly discarding (for inbred
lines only) |
|
|
FST_WC84-pValue.xls |
P-value
determined by permutating genotypes/alleles |
|
|
GlobFst.xls |
Global FST, FIS, FIT over all loci,
for each locus separately and the P-values for corresponding Fst-estimates GST (Nei)
values and corresponding P-values |
|
|
LocusFHeterogeneity.xls |
Calculates
the 95%/99% confidence interval of FST
by resampling a given number of loci (with replacement) |
|
|
Beta_POP.xls |
|
|
|
Betaij_POP.txt |
|
|
Formats&Data |
|
|
|
|
Genepop.gen |
Genepop
Format |
|
|
GenepopRD.gen |
Randomly
discarded genepop format |
|
|
FILENAME_2C_RD |
datasheet
in 2 column format, randomly discarded |
|
|
FILENAME_1C_RD |
datasheet
in 1 column format, randomly discarded |
|
|
POPNAME. beau.infile |
msvar
Ð infile for each population separate |
|
|
FILENAME.migrate |
Migrate/LAMARC
input file |
|
|
FILENAME.arlequin.arp |
Arlequin
input file |
|
|
FILENAME.struct |
Input file
for Structure |
|
Group_data |
|
Calculates
the unweighted average from populations within a specified group |
|
|
Hetexpgroup.xls |
Expected
heterozygosity split by group and loci |
|
|
HetexpRDgroup.xls |
Expected
heterozygosity split by group and loci based on the mean of 200
randomly discarded data sets |
|
|
Vargroup.xls |
Variance
split by group and loci |
|
|
VarRDgroup.xls |
Variance
split by group and loci based on the mean of 200 randomly discarded
data sets |
|
|
VarRDrepeatgroup.xls |
Variance
in repeat number split by group and loci based on the mean of 200
randomly discarded data sets |
|
|
Varrepeatgroup.xls |
Variance
in repeat number split by group and loci |
|
|
SumGrpXX.xls |
Corresponds
to the file Summary.xls, but separate for each group and split only by
loci |
|
Resampling_data |
|
Randomized
range of gene diversity for each locus and population |
|
|
AlleleRangeMax.xls |
Maximum
allele number (determined by bootstrapping) split by locus and
population |
|
|
AlleleRangeMean.xls |
Mean
allele number (determined by bootstrapping) split by locus and
population |
|
|
AlleleRangeMin.xls |
Minimum
allele number (determined by bootstrapping) split by locus and
population |
|
|
HetRangeMax.xls |
Maximum
gene diversity (determined by bootstrapping) split by locus and
population |
|
|
HetRangeMean.xls |
Mean gene
diversity (determined by bootstrapping) split by locus and population |
|
|
HetRangeMin.xls |
Minimum
gene diversity (determined by bootstrapping) split by locus and
population |
|
|
VarRangeMax.xls |
Maximum
variance (determined by bootstrapping) split by locus and population |
|
|
VarRangeMean.xls |
Mean
variance (determined by bootstrapping) split by locus and population |
|
|
VarRangeMin.xls |
Minimum
variance (determined by bootstrapping) split by locus and population |
|
|
NAME_AlleleRange.xls |
Report of
all allele numbers obtained by N bootstrap replications |
|
|
NAME_HetRange.xls |
Report of
all gene diversities obtained by N bootstrap replications |
|
|
NAME_VarRange.xls |
Report of
all variance obtained by N bootstrap replications |
|
Single_data |
|
all of
them split by loci and populations |
|
|
AllelicRichness.xls |
Reports
the calculated values of allelic richness |
|
|
GST.xls |
GST
per locus and global (Nei as well as Hamrik & Godt) |
|
|
Hetexp.xls |
Expected
heterozygosity |
|
|
HetRDexp.xls |
Expected
heterozygosity based on the mean of 200 randomly discarded data sets |
|
|
MaxAllele.xls |
Maximum
allele length |
|
|
Mean.xls |
Mean
allele length (in the case of RD: based on the mean of 200 randomly
discarded data sets) |
|
|
MinAllele.xls |
Minimum
allele length |
|
|
NumAlleles.xls |
Number of
alleles |
|
|
NumChromosomes.xls |
Number of
analyzed chromosomes |
|
|
Shannon.xls |
Shannon
index |
|
|
Var.xls |
Variance
in allele length |
|
|
VarRD.xls |
Variance
in allele length based on the mean of 200 randomly discarded data sets |
|
|
Varrepeat.xls |
Variance
in repeat number |
|
|
VarRDrepeat.xls |
Variance
in repeat number based on the mean of 200 randomly discarded data sets |
Dieringer, Daniel &
Schlštterer, Christian (2003)
Microsatellite analyser (MSA): a platform independent analysis tool for
large
microsatellite data sets. Molecular Ecology Notes 3 (1), 167-169
daniel.dieringer@boku.ac.at
The program can be found
here.
Copyright ©
2001,2002,2003,2004,2005,2006,2007 Daniel
Dieringer.
Permission to use and
distribute this software and its
documentation for any purpose is hereby granted without fee, provided
the above
copyright notice, author statement and this permission notice appear in
all
copies of this software and related documentation.
THE SOFTWARE IS PROVIDED
"AS-IS" AND WITHOUT
WARRANTY OF ANY KIND, EXPRESS, IMPLIED OR OTHERWISE, INCLUDING WITHOUT
LIMITATION, ANY WARRANTY OF MERCHANTABILITY OR FITNESS FOR A PARTICULAR
PURPOSE.IN NO EVENT SHALL THE AUTHOR, THE "INSTITUT F†R TIERZUCHT UND
GENETIK" OR THE VETERINARY UNIVERSITY OF VIENNA BE LIABLE FOR ANY
SPECIAL,
INCIDENTAL, INDIRECT OR CONSEQUENTIAL DAMAGES OF ANY KIND, OR ANY
DAMAGES
WHATSOEVER RESULTING FROM LOSS OF USE, DATA OR PROFITS, WHETHER OR NOT
ADVISED
OF THE POSSIBILITY OF DAMAGE, AND ON ANY THEORY OF LIABILITY, ARISING
OUT OF OR
IN CONNECTION WITH THE USE OR PERFORMANCE OF THIS SOFTWARE.
Bowcock,
A.M., Ru’z-Linares, A., Tomfohrde, J., Minch, E., Kidd, J.R.,
Cavalli-Sforza, L.L. (1994) High resolution human evolutionary trees
with
polymorphic microsatellites. Nature, 368: 455-457
Cavalli-Sforza,
L.L. and Bodmer, W.F. (1971) The Genetics of Human Population, p. 399,
San
Francisco, W.H. Freeman and Company
Cavalli-Sforza,
L.L., and Edwards, A.W.F. (1967) Phylogenetic analysis: models and
estimation
procedures. Amer. J. Hum. Genet. 19: 233-257.
Culley, T.M., Wallace,
L.E., Gengler-Nowak, K.M., and Crawford, D.J. (2002) A comparison of
two
methods of calculating GST, a genetic
measure of population
differentiation. Amer. J. of Botany 89(3): 460-465.
Dubois, D. and
Prade, H. (1980) Fuzzy Sets and Systems: Theory and Applications, p.
24, New
York, Academic Press.
El Mousadik A.
and Petit R.J., 1996. High level of genetic differentiation for allelic
richness among populations of the argan tree [Argania spinosa (L) Skeels]
endemic to morocco. Theor. Appl. Genet. 92: 832-839
Evens,
W.J.
(1972) The sampling theory of selectively neutral alleles. Theor.
Popul. Biol.
3: 87-112
Goldstein, D.B., Ruiz Linares,
A., Cavalli-Sforza,
L.L. and Feldman, M.W. (1995a) Genetic absolute dating based on
microsatellites
and the origin of modern humans. Proc. Natl. Acad. Sci. USA 92:
6723-6727.
Goldstein, D.B.,
Ruiz Linares, A., Cavalli-Sforza, L.L. and Feldman, M.W. (1995b) An
evaluation
of genetic distances for use with microsatellite loci. Genetics 139: 463-471.
Hedrick, P.W, 2005. A
standardized genetic
differentiation measure. Evolution 59(8): 1633-1638.
Hurlbert, S.H., 1971. The
nonconcept of species diversity: a critique and alternative parameters.
Ecology
52:577-586
Kimura, M. and Ohta, T. (1975)
Distribution of allelic
frequencies in a finite population under stepwise production of neutral
alleles. . Proc. Natl. Acad. Sci. USA 72: 2761-2764.
Krebs, C.J., 1989.
Ecological Methodology. Harper & Row. New York.
Michalakis, Y.
and Excoffier, L. (1996) A genetic estimation of population subdivision
using
distances between alleles with special references for microsatellite
loci.
Genetics 142: 1061-1064.
Nei, M., Tajima,
F. and Tateno, Y. (1983) Accuracy of estimated phylogenetic trees from
molecular data. J. Mol. Evol. 19: 153-170
Nei, M. (1978)
Estimation of average heterozygosity and genetic distance from a number
of
individuals. Genetics 89: 538-590
Nei M.(1987) eq.
(7.39) p.164 Molecular Evolutionary Genetics Columbia University
Press,
New York
Slatkin, M.
(1995) A measure of population subdivision based on microsatellite
allele
frequencies. Genetics 139: 457-462
Shannon, C.E. and
Weaver, W. (1949) The Mathematical Theory of Communication. University
of
Illinois Press, IL
Weir, B.S. and
Cockerham, C.C. (1984) Estimating F-Statistics for the Analysis of
Population
Structure, Evolution 38(6): 1358-1370
Weir, B.S. and
Hill, W.G. (2002) Estimating F-Statistics, Annu. Rev. Genet. 36: 721-750
Changes
with version 3.00:
Bugfixes:
á
Problems with distance
calculations D1, (dµ)2, Dad.
Note that the previous version
incorrectly estimated the distances based on PCR product size rather
than
repeat length
á
Dc per
locus was calculated incorrectly
both bugs were reported by Ana Dominguez Sanjurjo
Note if
you intend to use D1, (dµ)2, Dad or Dc
per locus,
do NOT use versions earlier than 3.0
New features:
Estimate for sampling variance
of gene diversity:
Calculates the range of gene
diversity (min, mean,
max) determined by bootstrapping
Estimate of theta based on
gene diversity and the SMM
mutation model
Bugfixes with
version 3.01:
á
Calculation of theta based on
gene diversity and the SMM mutation model
is (obvious) wrong when a locus occurs with gene diversity 1. The error
writes
the correct result instead in the file ThetaRDexp.xls in the file
Thetaexp.xls.
Version 3.10:
á
New function added: estimates
heterogeneity of the FST
values by bootstrapping a specified number of loci.
Version 3.12:
á
Calculation of D1 (ASD)
between individuals is now suppressed, as it
requires the variance of the population.
Version 3.14:
á
A bug in global FST calculations was
removed that replaced
P-value for the global FST with zero when
it was larger then the
minimum (1/number of permutation)
Version 3.15:
á
Version 3.14 had a problem to
generate genepop Ð formatted files. This
problem is now fixed.
Version 3.17:
á
MSA is able to write
individuum based distance files in NEXUS format
instead of PHYLIP format. (Please note that this function is only
without
bootstrapping possible).
á
Changing the menu structure
for easier understandability of the Fst-menu.
Version 4.00:
á
MSA is now able to do the
analysis with the command line arguments (see
topic above).
á
The function "sampling
variance of gene diversity" had an
error when individuals are sampled.
á
The same function gives a
wrong result for zero correction, this is now
corrected.
Version 4.02:
á
Output of tabbed results for
FIS was Ðnan when the number of alleles was
1. This is now corrected to "n.d."
á
MSA can now create input files
for IM (see above)
á
MSA calculates now the FST Ð like
moment estimators βi/βij
statistic (see above)
Version 4.04:
á
MSA outputs now when do
hetrange analysis also the variance and the
number of alleles.
á
Adding allelic richness to the
overview methods.
Version 4.05:
á
For bootstrapping of distances
it is possible to set up the number of
loci that will be used for replication data set.
á
Adding the variance value of
allelic richness.
á
Small changes in documentation
á
Data files has no longer to be
located in the same folder as the MSA
executable
á
Included GST and GST'
in descriptive statistics
and in Global FST calculation
(including p-Values)
Description
of genetic
distances
D1, ASD,
Average
Square [Goldstein et
al., 1995b ; Slatkin, 1995]:
The average
square distance was derived by employing
the analytical theory developed by Moran for the distribution of
alleles
mutating under a strict stepwise mutation process in a population of
finite
constant size with non overlapping generations. It and its family of
related
distances ((dm)2)
is superior to other distances for
microsatellites in that they have a linear expectation with time making
them
good for evolutionary studies.
Nk=(Mean(Pop1,k)-Mean(Pop2,k))^2+(ni-1)*Var(Pop1,k)/ni+(nj-1)*Var(Pop2,k)/nj
D=number of
loci
N=Sk(Nk)
Sum
over all loci (k=1-D)
ASD=N/D
Distance
based on individuals is not calculated, since
D1 is equal to (¶m)2
[Ddm], when the variance term is removed.
Dps,
Proportion of shared alleles [Bowcock et al., 1994]
The general
definition of the proportion of shared
alleles at a given locus, which holds true whether the taxa are
individuals or
population samples, is the mean over loci of the sums of the minima of
the
relative frequencies of all alleles between compared taxa.
ps=SkSamin(
fa,i , fa,j )/D
Sum over all
loci and all alleles
fa,i/a,j
= frequency of allele a in pop i/j
D=number
of loci
The distance
can be taken as: Dps = -ln(ps), or Dps' =
1-ps
Dfs,
Fuzzy set similarity [Dubois
and
Prade, 1980]
The fuzzy set
similarity for a pair of taxa is the
ratio between the cardinality of the intersection of their alleles and
the
cardinality of the union of their alleles, e.g., if two individuals
have
genotypes ab and ac, the intersection is {a}, the union is {a,b,c}, and
the
ratio is 1/3.
The distance
can be taken as: Dfs = -ln(fs), or Dfs'=
1-fs
Dkf,
Kinship coefficient [Cavalli-Sforza and Bodmer, 1971]
The kinship
coefficient is the probability that a gene
taken at random from population i (at a given locus) be identical by
descent to
a gene taken at random from population j at the same locus.
kf=SkSa
( fa,i * fa,j )/D
Sum over all
loci and all alleles
fa,i/a,j
= frequency of allele a in pop i/j
D=number
of loci
The distance
can be taken as: Dkf = -ln(kf), or Dfs'=
1-kf
Dad=Sk abs(
Mean(Pop1,k) - Mean(Pop2,k)) /D
Sum over all
Loci
Mean(Pop1/2,k)
... Mean Allele of population 1/2 in Locus k
D=Number
of Loci
(¶m)2,
Ddm [Goldstein
et al. 1995a]
Ddm=Sk (
Mean(Pop1,k) - Mean(Pop2,k))^2 /D
Sum over all
Loci
Mean(Pop1/2,k)
... Mean Allele of population 1/2 in Locus k
D=Number
of Loci
Dc
[Cavalli-Sforca
and
Edwards, 1967]
Dc=2
Sk
(Dc,k)/(p
D)
Sum over all
Loci
Dc,k
= sqrt(2(1+Sa(sqrt(fa,i
* fa,j ) )))
Sum over all
Alleles
D=Number
of Loci
fa,i/a,j
= Frequency of allele a in Pop i/j
Da
[Nei et al. 1983]
Da=1
- SkSa
sqrt( fa,i * fa,j )/D
Sum over all
Loci and all Alleles
fa,i/a,j
= Frequency of allele a in Pop i/j
D=Number
of Loci
D [Nei,
1978]
Nei's
standard genetic
distance
Sum1= sqrt((nCk1*Sa
( fa,i * fa,i )-1)/(nCk1-1))
Sum2= sqrt((nCk2*Sa
( fa,j * fa,j )-1)/(nCk2-1))
id=Sk(Sa
( fa,i * fa,j )/( Sum1*Sum2) )/DL
Sum over all
Loci and all Alleles
fa,i/a,j
= Frequency of allele a in Pop i/j
nCki/kj
= Number of Chromosomes of Locus k in Pop i/j
DL=Number of Loci
The distance
can be taken as: D= -ln(id), or D'= 1-id
FST,FIS,FIT [Weir and Cockerham,
1984]
For one
Allele:
FIT,l,a=1-(c/(a+b+c))
FST,l,a=a/(a+b+c)
FIS,l,a=1-(c/(b+c))
a = nq
(s^2-(pq(1-pq)-(r-1)s^2/r-hq/4)/(nq-1))/nc
b
= nq (pq(1-pq)-(r-1)s^2/r-(2nq-1)hq/(4nq))/(nq-1)
c
= hq/2
pi
... frequency of allele A in population
i
ni
... sample size of population i
hi
... observed proportion of individuals heterozygous for
allele A
nq
... average sample size (genomes!)
nc
... (r nq- Si(ni^2)
/ (r
nq))/(r-1)
r
... number of compared populations
pq
... Si(ni
pi)
/ (r nq)
average sample frequency of
allele A
s^2...
Si(ni
(pi-pq)^2)/((r-1)
nq)
sample variance of allele A
frequencies over populations
hq
... Si
(ni hi)
/(r nq)
average heterozygote
frequency for allele A
Over all
alleles and loci:
FIT= SlSa
Fit,l,a
FST=
SlSa
Fst,l,a
FIS=
SlSa
Fis,l,a
Note: FST-values
over all loci per pair, are calculated excluding all loci, which are
missed in
one of the populations.
Alleles or genotypes
of each pair of populations are permuted N times.
Resampling
units are alleles (when you assume Hardy-Weinberg)
respectively genotypes (not assuming Hardy-Weinberg).
The result is
the proportion of permuted FST-values
equal or greater than the observed FST (in the upper
triangle)!
The
lower triangle contains these proportions multiplied by the number
of tests (=strict Bonferroni - correction).
These
values are the probability of rejecting the hypothesis that
populations are equal.
A
value greater than 0.05 will be replaced with ns (=non signifikant).
In
general N should be greater than: Number of tests / level of
significance
If
you want to get this Number before make your permutations, analyse
your data without distances and choose in the main-menu the option [s]
to show data information or caluculate: (P*P-P)/2 {where P is the
number of
populations}.
Handling
inbreeding lines:
To
get a better performance when analysing inbred lines, you can choose
the random discarding option before each permutation (for all
"haploid" population).
This
will give you the mean over all randomdiscarded Fst-values,
as well the P-value for them.
Also
you get the upper and lower border of the 95%CI.
But in practice, this procedure is in most cases not necessary, because
non-discarded data sets are not biased and do not deviate from the mean
of 1000
randomly discarded data sets (data not shown).
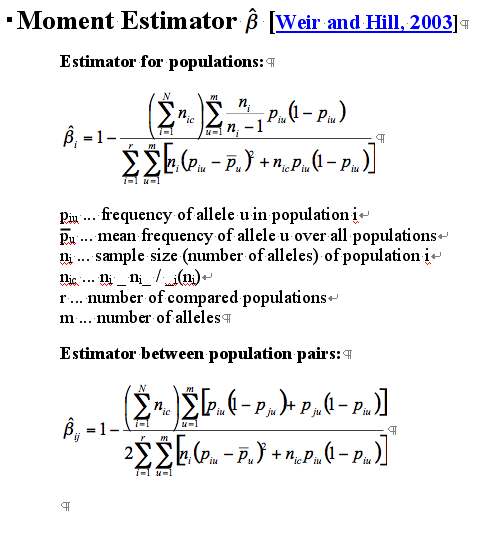
Moment Estimator ![]() [Weir
and Hill,
2003]
[Weir
and Hill,
2003]